
Sporting goods retailer
Big 5 Sporting Goods (NASDAQ: BGFV) shares have grinded to multi-year highs seen as a
pandemic benefactor with the closure of gyms. The stock has outperformed the benchmark
S&P 500 index (NYSEARCA: SPY) as sporting goods and
athleisure stocks have been on a tear this year.
As the economic restarts continue to accelerate, Big 5 should continue to see acceleration in store traffic. However, in the event pandemic induced rollbacks, the demand can still accelerate as exercise-at-home trends get bolstered with the colder weather and holiday shopping season approaching. The bar has been set high heading into its earnings and prudent investors should watch for a potential sell-the-news reaction for opportunistic pullback levels to gain exposure.
Q2 FY 2020 Earnings Release
On July 27, 2020, Big 5 released its fiscal second-quarter 2020 results for the quarter ending June 2020. The Company reported an earnings-per-share (EPS) profit of $0.52 or $11.1 million net income. Revenues fell (-5.2%) year-over-year (YoY) to $227.93 million. The Company saw same-store-sales (SSS) rise 31.9% YoY for the month of July. The Company paid down the revolver to a zero balance and is debt-free and reinstated its dividend retroactively. By the end of fiscal July 2020, the Company had $38 million in cash with 431 stores open and operating.
Conference Call Takeaways
Big 5 Sporting Goods CEO, Steve Miller, highlighted specific details on Q2 and insights into Q3 2020 during the conference call. Same store sales (SSS) for Q2 had fallen (-4.2%) on average. In the first-half of Q2 during the pandemic peak, SSS had fallen to (-28.2%) from store closures but increased to 15.5% YoY in the latter half of the quarter from the pent-up demand as stores reopened. Expenses fell to 26% of revenues due to reduced store hours, advertising and labor costs. Cash flow grew to $58.2 million for first-half of 2020 compared to $5.6 million prior year. Higher merchandise margins beefed up gross margins to 31.7% compared to 30.3% in Q2 2019.
For fiscal July, Big 5 is seeing more transactions and larger basket sizes result in higher average tickets. Additionally, merchandise margins continued to expand by 200 basis points YoY while still operating under limited store operating hours, capacity restrictions and “substantially reduced” advertising. As consumers seek more active and healthy lifestyles during the pandemic, “incredible strength” was seen in the home fitness and individual stores categories. This is a by-product from the closure of health clubs and gyms impacted by COVID-19. This strength was offset by the softness in demand for league seasons and school activities. The biggest issue in Q2 was supply chain constraints to meet the demand, but these issues seem to have been alleviated.
Raising YoY Q3 2000 Guidance
The strong Q2 and insights provided by the first month of Q3 enabled Big 5 Sports to raise its forward guidance. The Company expects Q3 2020 SSS to rise in a range between 14% to 20% and diluted EPS to range between $1.00 to $1.30 compared to $0.30 EPS in Q3 2019. The Company had a (-15%) reduction in merchandise inventory in Q2 is expected to be reintroduced moving forward. Fiscal 2020 capex is expected to range between $5 million to $9 million. The Company is hitting on all cylinders heading into the Q3 2020 release as the bar is set very high. Prudent investors should watch for opportunistic pullback levels rather than chase ahead of the release especially if a sell-the-news reaction forms.
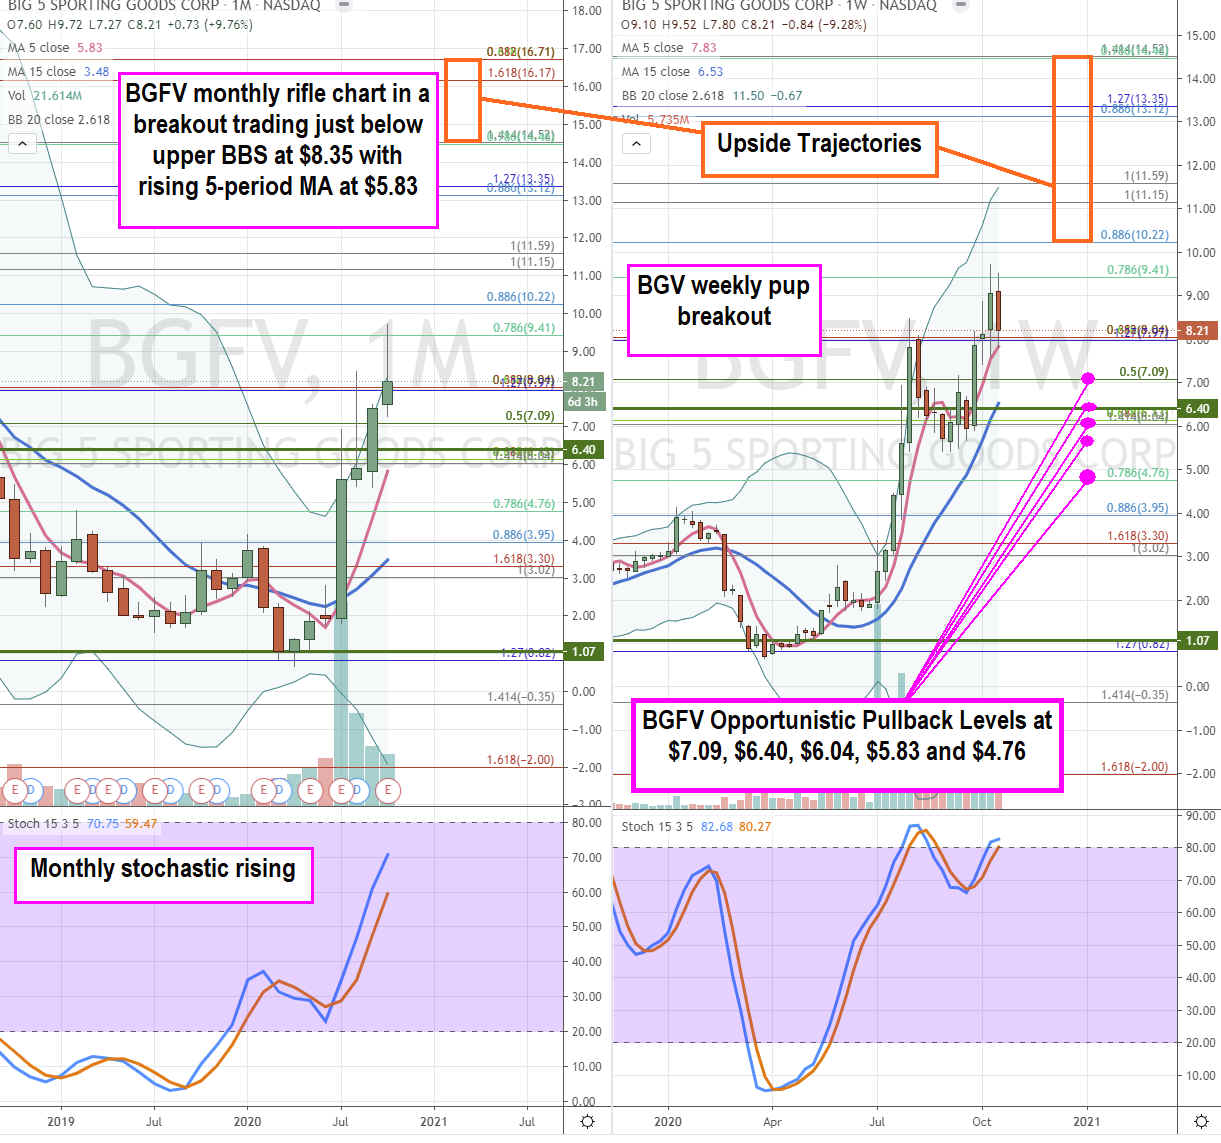
BGFV Opportunistic Pullback Levels
Using the rifle charts on the monthly and weekly time frames provides a broader view of the landscape for BGFV stock. The monthly rifle chart has been in a stochastic mini pup breakout that overshot and is now trading near its upper Bollinger Bands (BBs)near the $8.04 Fibonacci (fib) level with a rising 5-period moving average (MA) at $5.83. The weekly rifle chart triggered a market structure low (MSL) buy at $6.41. The weekly stochastic has crossed back up again triggering the pup breakout with upper BBs at the $11.59 fib and rising 5-period MA support at $7.83. The bar is set high heading into the Q3 2020 earnings which makes it vulnerable to a sell-the-news reaction or a trigger a multiple expansion. Prudent investors should watch the reaction for potential entries on opportunistic pullback levels at the $7.09 fib, $6.40 weekly MSL fib, $6.04 fib, $5.83 fib and $4.76 fib. For nimble traders seeking an earlier entry can consider trading off the $8.04 fib in the event of a multiple expansion. The upside trajectories range from $10.22 to $16.71.
Companies in This Article: