
Household durable goods leasing company
Rent-A-Center (NASDAQ: RCII) shares have been on a tear as a
pandemic benefactor. The stock has outperformed the benchmark
S&P 500 index (NYSEARCA: SPY). As the economic restarts get threatened by the signs of a second and third wave of COVID-19, Rent-A-Center continues to be a beneficiary as stay and work at home trends get prolonged. The rent-to-own trend is a byproduct of the
pandemicas incomes contract with continued delay of additional federal stimulus. Prudent investors looking for a defensive play into the economic restart deceleration can consider opportunistic pullbacks to gain exposure in RCII shares.
Q2 FY 2020 Earnings Release
On Aug. 8, 2020, Rent-A-Center released its fiscal second-quarter 2020 results for the quarter ending June 2020. The Company reported an earnings-per-share (EPS) profit of $0.80 excluding non-recurring items versus consensus analyst estimates for a profit of $0.60), beating estimates by $0.20. Revenues grew 4.2% year-over-year (YoY) to $683.75 million beating analyst estimates of $605.94 million. The
Company saw same-store-sales (SSS) rise 7.8% YoY for the quarter. The Company paid down the revolver to a zero balance reducing total outstanding debt to $199 million. Total cash was $206 million with total liquidity around $418 million at the end of Q2. The Company is anticipating a working capital investment to accommodate demand in 2H 2020 and reinstall the share buyback program and reinstatement the dividend. Rent-A-Center raised full-year 2020 EPS guidance to $2.45 to $2.85 versus $2.30 consensus analyst estimates.
Conference Call Takeaways
Rent-A-Center CEO, Mitch Fidel, highlighted the significant performance in the quarter. The Company “achieved the highest EBITDA margin in years.” at 12.6%. The Preferred Lease division achieved 8% revenue growth and 25% invoice volume growth despite two-thirds of retail stores being closed due to pandemic mandates. As stores started reopening in May and June, demand acceleration carried through the quarter and is expected to continue into the end of the year. The business tends to experience expansion during recessions as consumers are faced with tighter credit options. Fidel noted, “Demand for products to improve the home is trending well with our strongest performance in furniture and appliances.” E-commerce sales rose by 60% YoY to make up 19% of total revenues. Fidel remarked, ”Our E-commerce customers are generating more profit for Rent-A-Center than our brick-and-mortar customers, and we expect the business to account for over 25% of Rent-A-Center sales by the end of 2020.”
Surprise Upside Preannouncement
Rent-A-Center delivered a surprise upside preannouncement jolting shares to multi-year highs. On Sept. 21, 2020, Rent-A-Center pre-announced upside EPS guidance for Q3 2020 to the range of $0.95 to $1.05 versus $0.61 consensus analyst estimates. Revenues for Q3 2020 were raised to $695 million to $715 million versus $687 million analyst estimates. The full-year 2020 EPS guidance was raised to $3.15 to $3.45 versus previously raised analyst estimates of $2.75. Full-year 2020 revenues are expected in the range of $2.78 billion to $2.83 billion versus $2.77 consensus estimates.
Recession Hedge
CEO Mitch Fidel summed it up best when he stated, “We don’t expect VOCID, higher unemployment rates or the recession environment to have a material impact on skip/stolen losses in 2020, which, again, underscores the value of the lease-to-own business model during difficult times.” This galvanizes the Company and its stock as a hedge against economic deceleration from the effects of a second or third wave of COVID-19. The bar has been set high due to the preannouncement for Q3 earnings ahead of the Sept. 28, 2020, release. Prudent investors can monitor shares for opportunistic pullbacks into or in reaction to Q3 earnings release in case a sell-the-news effect forms.
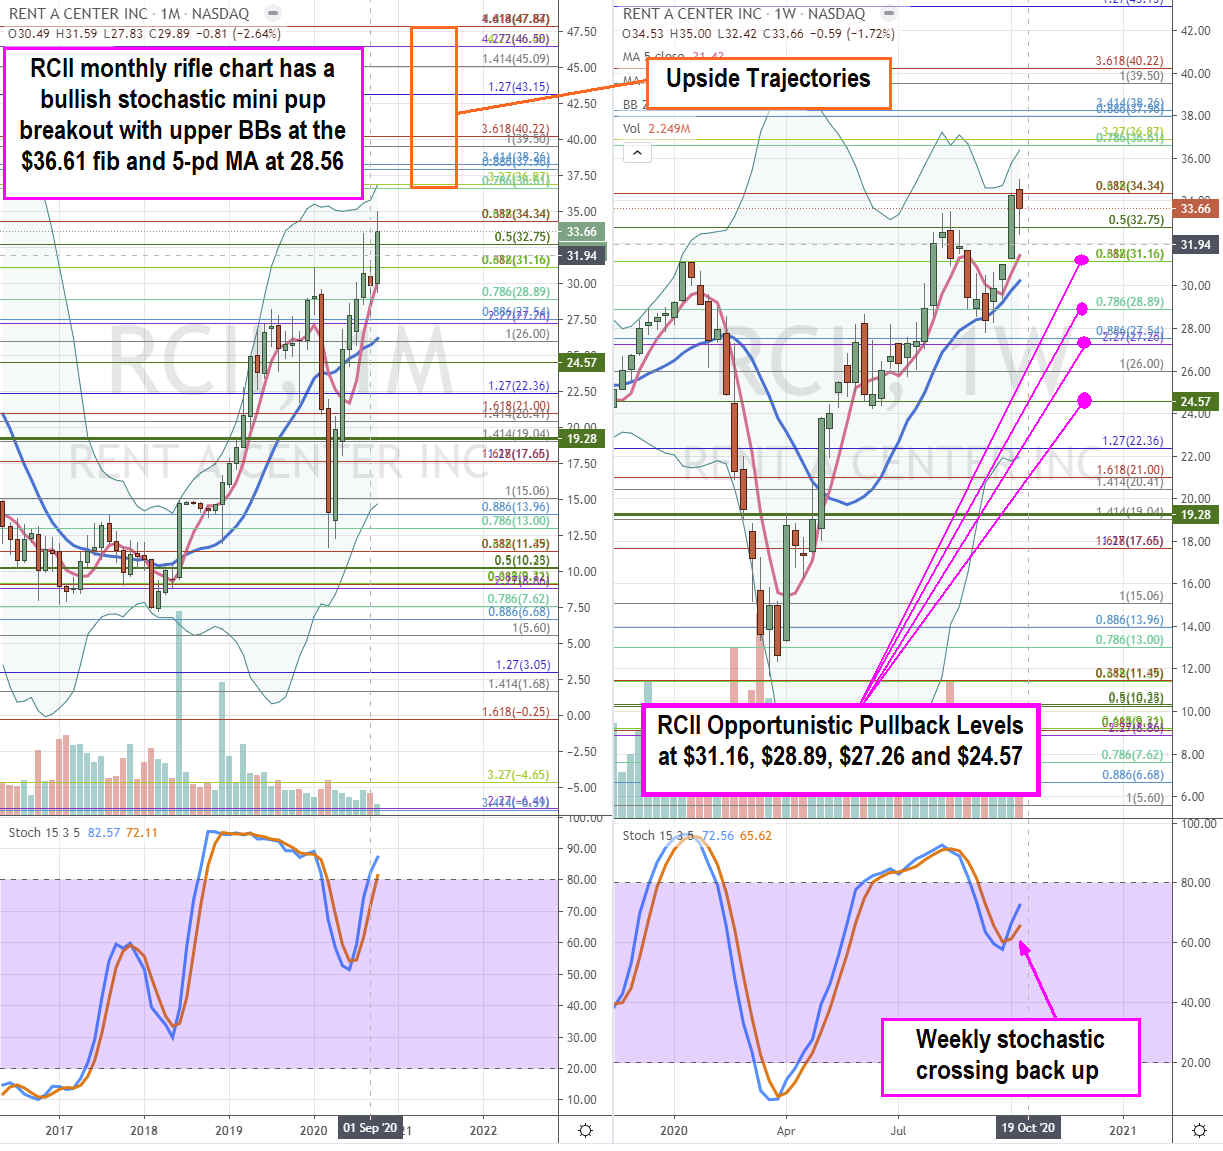
RCII Opportunistic Pullback Levels
Using the rifle charts on the monthly and weekly time frames provides a broader view of the landscape for RCII stock. The monthly rifle chart has a stochastic mini pup breakout in effect with upper Bollinger Bands (BBs) at $36.61 Fibonacci (fib) level with a rising 5-period moving average (MA) at $28.56. The weekly rifle chart triggered a market structure low (MSL) buy at $19.29 in April. The weekly stochastic has crossed back up with identical upper BBs at the monthly rifle chart. The bar is setting high ahead of Q3 2020 earnings which could result in a sell-the-news reaction or a multiple expansion. Either way, prudent investors should be careful not to chase and instead look for entry on opportunistic pullback levels at the $31.16 fib, $28.89 fib, $27.26 fib and $24.57 fib. In the event of a multiple expansion, the upside trajectories range from $36.61 to $47.84 range.
Companies in This Article: